Capturing Web Service (JAX-WS) messages in WebSphere
We wanted to capture some representative SOAP messages from our JAX-WS client Web Application (so that we could mock up a test service using SoapUI), and as it happens this is very easy to do with WebSphere trace settings.
References
DeveloperWorks article Troubleshooting JAX-WS applications with the WebSphere Application Server V6.1 Feature Pack for Web Services describes this, and other techniques, and at least this portion is still applicable to current versions of WebSphere.
Tracing web services is the reference Knowledge Center article for WebSphere 8.5.5.
Enable Trace
Using option 4 from that Knowledge Center article, on the WebSphere console, go to Troubleshooting > Logs and trace > ServerName > Change log detail levels
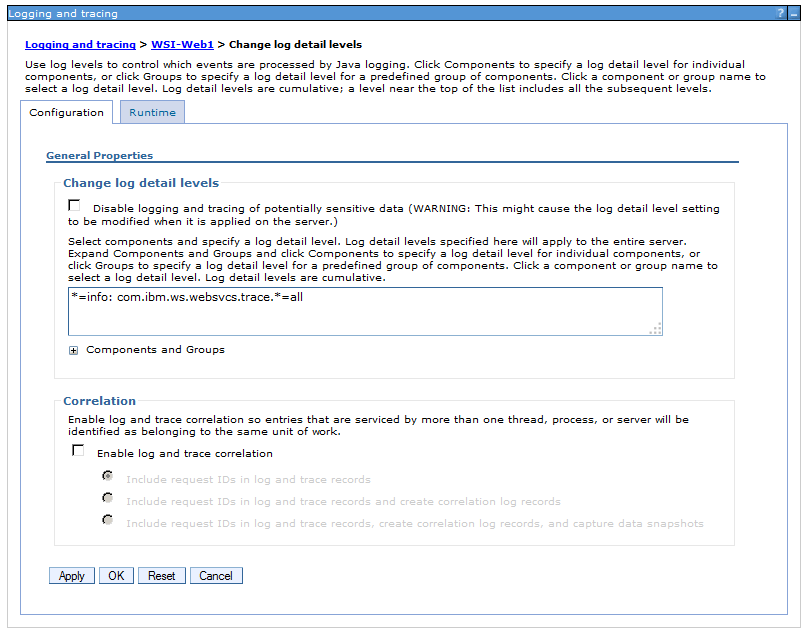
Then add the string “com.ibm.ws.websvcs.trace.*=all” (the colon is the separator between multiple log strings being traced).
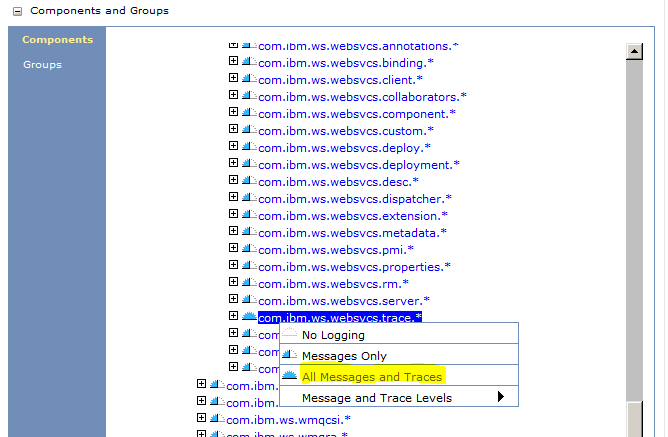
Or drill down via the “Components and Groups” selection list:
Trace Data
By default, the trace data is logged to ${SERVER_LOG_ROOT}/trace.log, where ${SERVER_LOG_ROOT} is the same location of the JVM logs, typically …profiles/ProfileName/logs/ServerName.
You can see and change this location in the console at Troubleshooting > Logs and trace > ServerName > Diagnostic Trace, in the File Name field.
When you look in this file, you will see XML dumps of incoming and outgoing JAX-WS messages.
Don’t forget to disable trace when you’re finished capturing and need to optimize for normal Production use.